
Annual Survey Results: The State of Hospitality Tech 2025
The HYB Annual Tech Survey, conducted in May 2025, gathered 264 global responses from hotel companies, tech providers, consultants, and other industry stakeholders. This research was conducted with a goal to better understand the current state of hotel technology – what's working, what's not, and where the industry is headed next.
Key findings include
- 45% of hotel companies consider themselves tech-mature, yet 23% rated their maturity at 3 or below, highlighting a sharp divide in digital readiness.
- PMS and CRS are near-universal, while advanced tools like CDPs remain rarely adopted (under 10% usage).
- Budget allocation for technology remains modest, with most companies spending under 10%, and 15% being the most common figure.
- When evaluating new tech, ROI, guest experience, and integration ease are the top priorities—while AI and automation remain secondary concerns.
- Integration, fragmentation, and lack of industry standards are the most commonly cited frustrations by both hotel operators and tech vendors.
- Hotels are willing to innovate but they’re stuck in a tech jungle with no clear path forward. Both hoteliers and vendors will continue feeling like they’re solving a puzzle with mismatched pieces.
- Both hoteliers and vendors want collaboration but the ecosystem is misaligned. Vendors blame each other and the legacy tech stack. Hotels blame integration limitations and outdated systems. Everyone blames fragmentation.
These results paint a picture of an industry that is eager to innovate but still navigating a complex, disconnected tech landscape.
Scope and Methodology
The survey gathered a total of 264 responses from industry professionals worldwide. It was distributed via direct email outreach and promoted through LinkedIn, targeting a diverse audience of stakeholders in the hospitality ecosystem.
The respondents represented several key types of businesses within the industry:
- Hotel Companies (operators, ownership groups, franchises) made up 33% of total (86 responses).
- Technology Providers – 38% of all respondents (101).
- Non-Technology Providers were 5% (12 respondents).
- Others were industry consultants, academics, media outlets and associations (24% of total).
For respondents identifying as hotel owners, management companies, and franchises, the survey asked about their portfolio size. The distribution of responses was as follows:

The largest regional representation was from North America, with 37.55% (95 respondents), with Global operations accounted for 28.46% (72 respondents) and Europe represented by 20.16% (51 respondents).

Current State of Technology Adoption
Respondents were asked to rate their organization's overall tech maturity on a scale of 1 to 10, where 1 signifies low maturity and 10 signifies fully integrated, cloud-based, and automated. 86 hotel companies respondents answered this question.
On a scale of 1 to 10, how would you rate your organization’s overall tech maturity?
1 = low maturity;
10 = fully integrated, cloud-based, and automated.

The average tech maturity rating, based on the survey responses, is approximately 5.35.
However, the distribution of responses shows a wide range of perceived maturity levels indicating that hotel tech maturity is polarizing.
Only 2 organizations gave themselves a perfect 10. This shows that even among tech-forward players, few feel they’ve “made it.”
Low maturity is still prevalent. Combining levels 0–3, we find that 23% of respondents self-identify as being on the very low end of the spectrum, with virtually no integration or automation. This confirms the industry’s well-known lag in digital transformation.
While the survey asked respondents to rate their organization's overall tech maturity on a scale of 1 to 101, a striking 14 out of 86 respondents (approximately 16.3%) gave a rating of 0. This is particularly fascinating because "0" was not part of the defined 1-10 scale1. The significant number of respondents selecting a value outside the provided range could suggest various interpretations: a perception of zero maturity, a non-applicable response, or perhaps a form of protest highlighting fundamental issues not captured by the scale.
An analysis of the relationship between company size and tech maturity reveals a weak but noticeable trend: larger hotel groups tend to rate themselves higher on the tech maturity scale. When it comes to geography, tech maturity appears evenly distributed across regions, with no region significantly outperforming others.
Which of the following systems are currently in use at your property/organization?
Respondents were also asked to indicate which of a list of systems are currently in use at their property/organization. As expected, the most commonly used system among hotel companies is the PMS (Property Management System) representing a 74.41% share.
The next most used systems are CRS/Booking Engine (63.95% share) and RMS (Revenue Management System) (50% share).
The CDP (Customer Data Platform) is still the least used system on the list, with only 8 respondents indicating its use. Given the industry focus on personalization and unified guest profiles, the low adoption of CDPs among these respondents is a noteworthy finding.

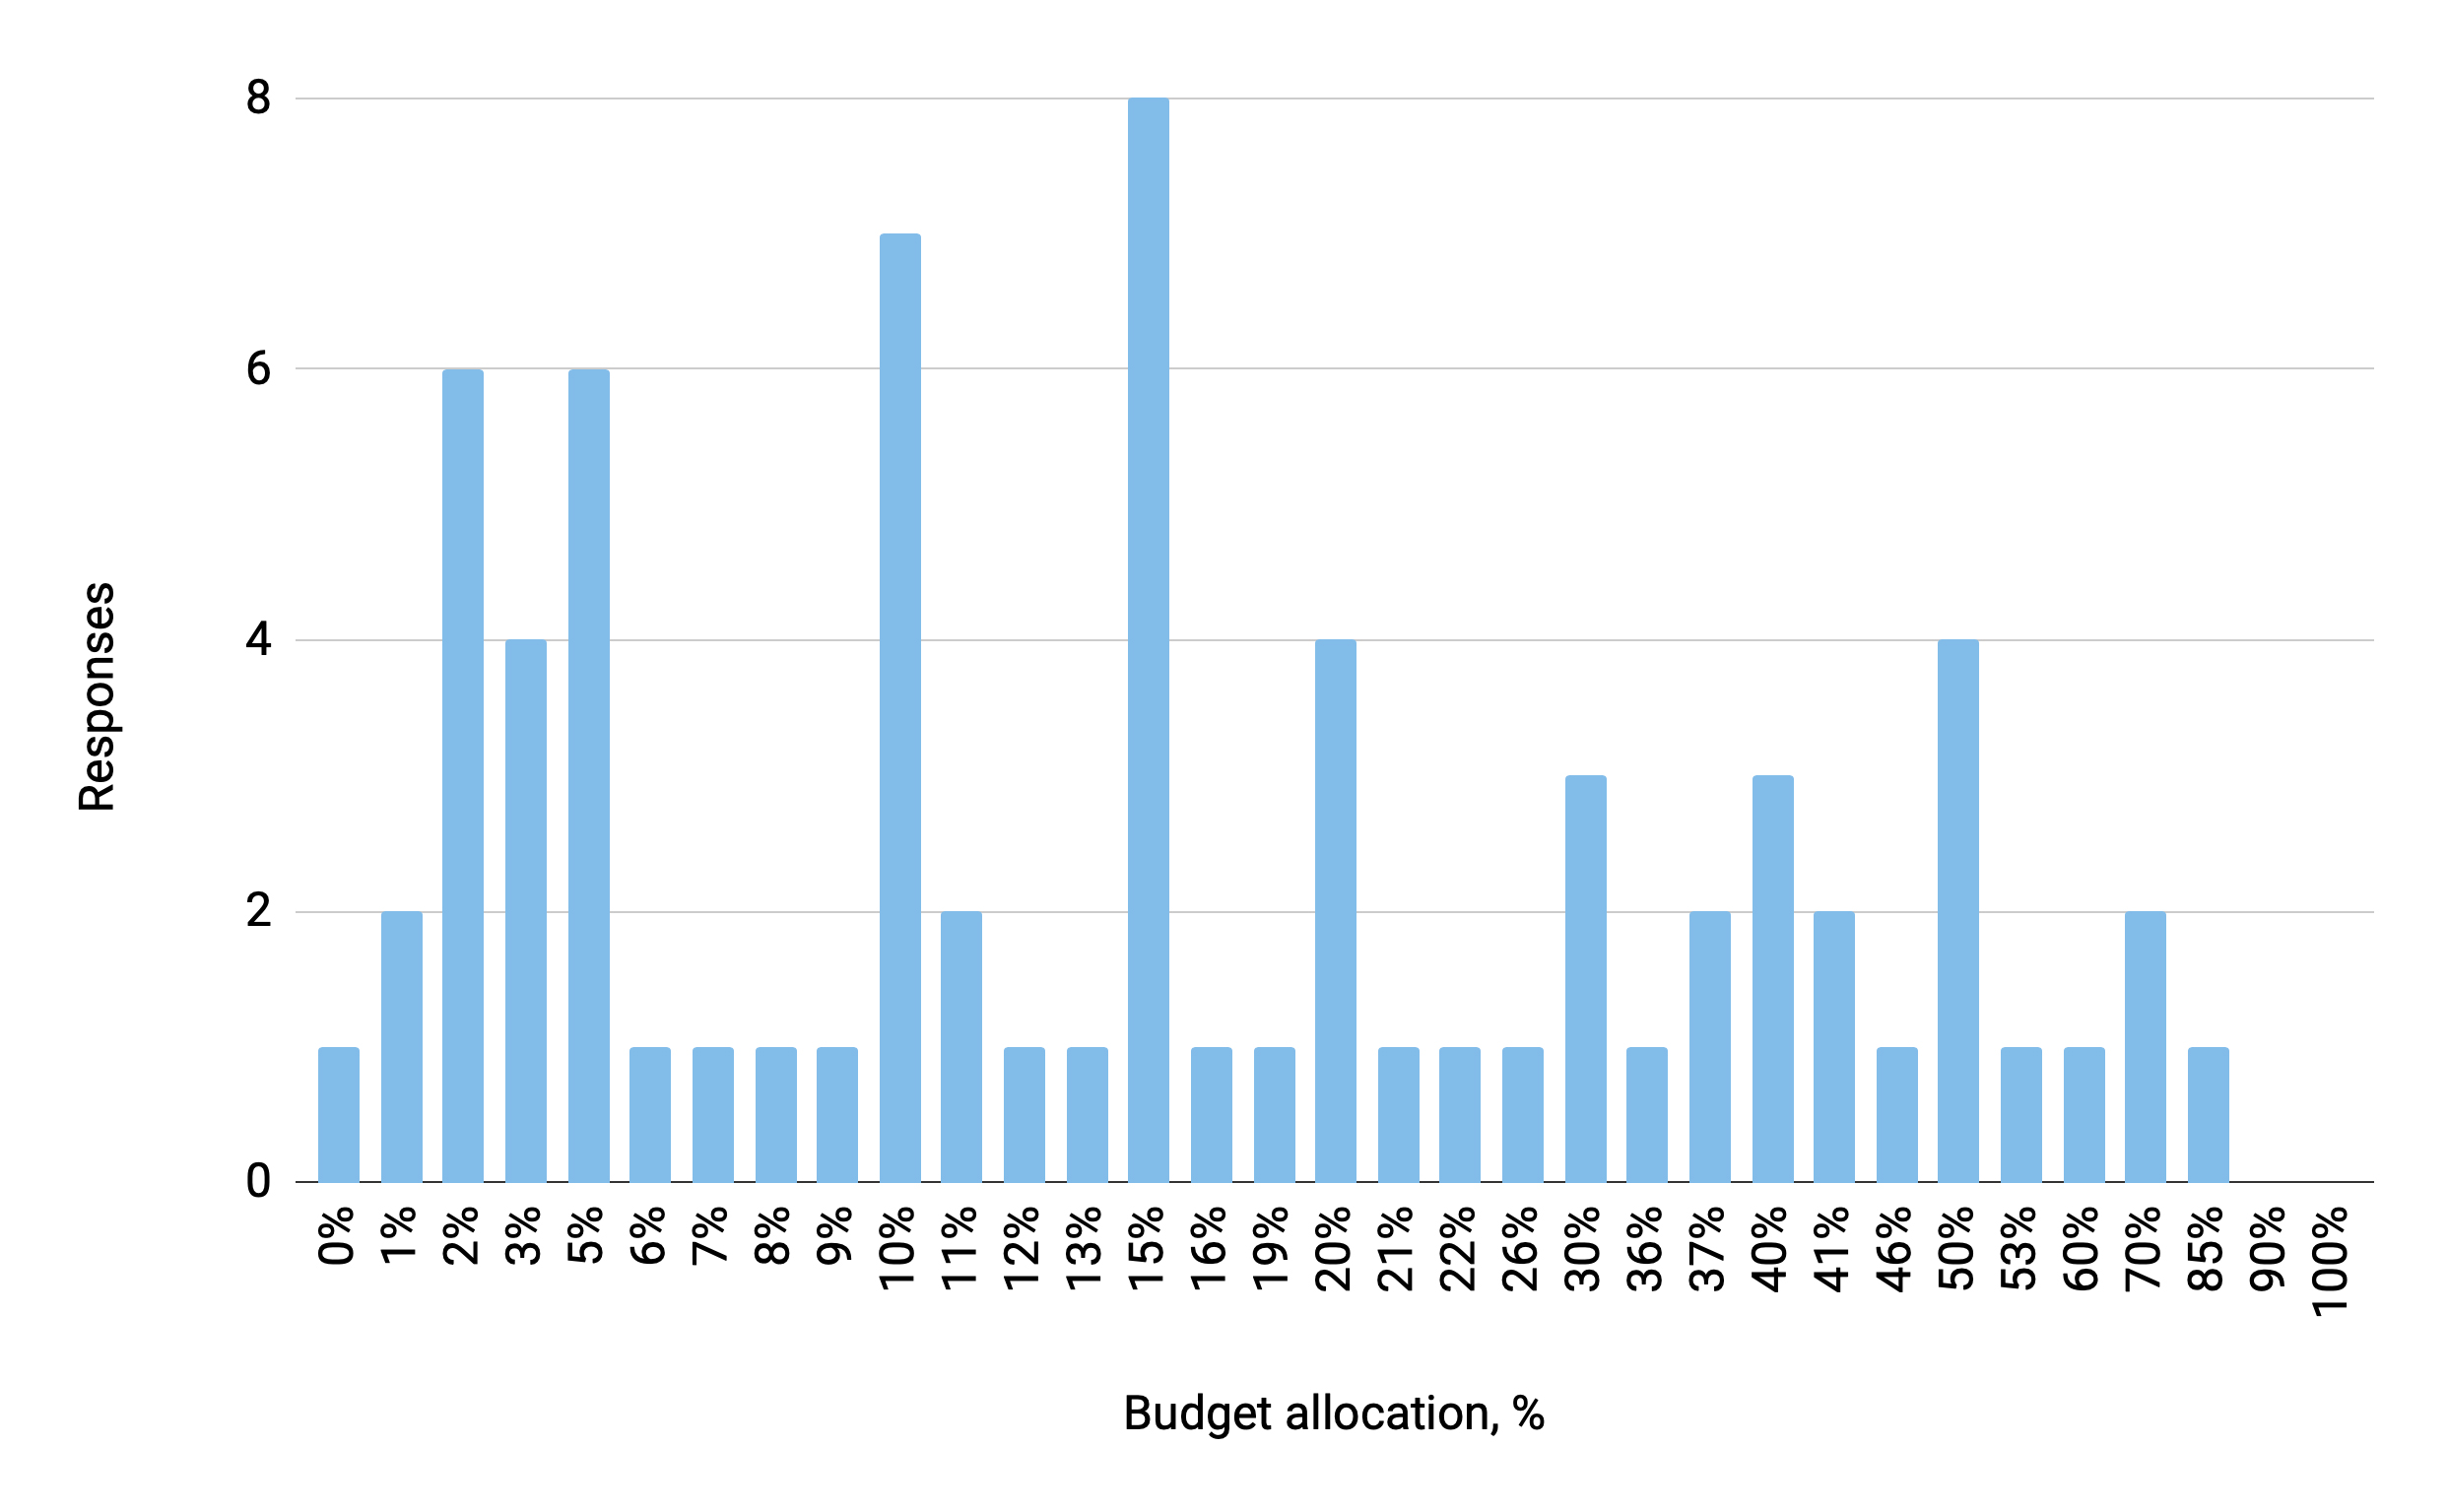
Roughly, what % of your company budget is allocated towards technology?
The average budget allocation towards technology is approximately 21%.
However, the responses show a wide variance in budget allocation, ranging from 0% to 85%. The most frequently cited percentage (mode) is 15% (8 respondents). Many percentages received only one or two mentions, indicating a lack of strong consensus on a typical technology budget percentage across the respondent base.
Overall, the data shows that most companies allocate very little to tech. Over 30% of respondents invest 5% or less of their budget in technology.
However, the distribution of tech budget allocation reveals a bimodal trend: while a significant portion of respondents allocate 5% or less of their budget to technology (suggesting limited investment and perhaps reliance on legacy systems) there is a noticeable cluster at the other end of the spectrum, with some companies dedicating 30–70% of their budgets to tech.
This “two-speed” adoption curve reflects a growing divide between early-stage digital adopters and tech-forward operators (often hybrid hospitality-tech companies) who view technology not as a cost center but as a strategic growth engine.
What is your top priority when evaluating new hotel technology?
Respondents were asked to select their top priority when evaluating new hotel technology.
Results show that hotel tech decisions are mainly driven by financial impact, guest-facing value, and ease of deployment. Emerging innovations like AI matter but only after the basics are in place. Vendors focusing on ROI, seamless integration, and enhancing the guest journey are most likely to win attention and adoption.
ROI / Profitability was the most frequently selected priority, chosen by 46 respondents (53.48% share).

What is your biggest current frustration with hotel tech?
This open-ended question elicited a wide variety of frustrations from different stakeholder groups. The dominant themes revolve around integration, fragmentation, and complexity.
Summary of responses received from Hotel Companies (ownership groups, operators, franchises):
- Integration issues were the most frequently cited frustration (e.g., "slow integration", "integration dependencies", "challenges with integrating solutions from several vendors").
- Fragmentation came up repeatedly: too many tools, not enough cohesion.
- Lack of standards and legacy infrastructure are slowing down adoption and innovation.
- There's growing irony fatigue around AI buzzwords when basic infrastructure (like Wi-Fi or check-in) isn’t functioning reliably.
- Operational lag, especially in segments like MICE, highlights major gaps in tech adoption across departments.
Technology Vendors:
- Vendors echo many of the same concerns, especially around fragmentation, silos, and poor interoperability.
- There’s frustration with the vendor ecosystem itself: issues like pricing barriers for integrations, inconsistent platform quality (PMS, CRS), and resistance to standardization.
- Data sharing and open APIs are cited as critical roadblocks, with many systems still limiting access or integration opportunities.
- Vendors are also seeing challenges with client-side adoption, training, and understanding of AI.
- Market immaturity and legacy dependency remain major pain points, even for newer tech providers.
The frustrations reveal a consistent truth: it’s not that hotels don’t want to innovate, it’s that they’re stuck in a tech jungle with no clear path forward. Until open standards, seamless integrations, and true data interoperability become industry norms, both hoteliers and vendors will continue feeling like they’re solving a puzzle with mismatched pieces.
Both sides want collaboration but the ecosystem is misaligned. Vendors blame each other and the legacy tech stack. Hotels blame integration limitations and outdated systems. Everyone blames fragmentation.